People in higher-level occupations have a longer life expectancy than manual workers but retire later, on average. Which occupational categories spend the most years in retirement ? Are any gender differences observed ? How do career histories and the pension system affect time spent in retirement ? To answer these questions, Florian Bonnet, Carlo-Giovanni Camarda, Emmanuelle Cambois, and Ophélie Merville mea- sure life expectancy across occupational categories at different ages, particularly around retirement ages.
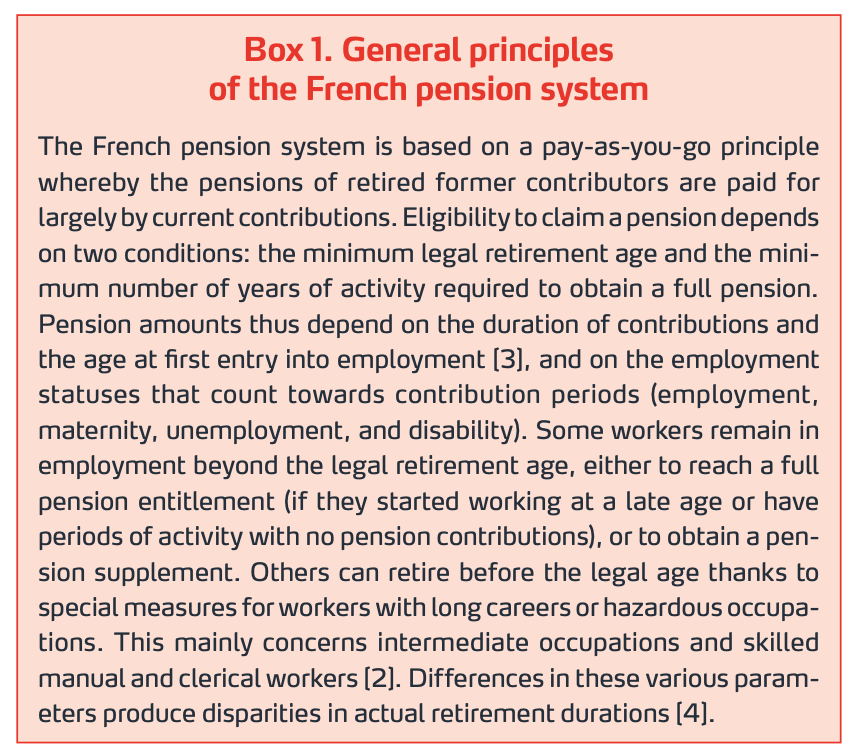
Social inequalities in life expectancy are an important component of the debate on retirement age as they affect both the likelihood of reaching this age and the number of years spent in retirement. Changes in activity status over a working career and status at retirement age also differ across social groups and are partly factored in by the solidarity mechanisms of the pension system. Durations of employment, inactivity, and unemployment matter because they determine not only pension entitlements but also the pension amount (Box 1). We examine these durations at different ages and at retirement age across the different occupational categories (OCs) in France.
Mortality data are used to calculate and analyse life expectancy at different ages and the disparities across OCs. For each OC, these years of life are then broken down according to the periods of activity (employment and unemployment) and inactivity (retirement, homemaking, or other reason) reported by individuals in the census (Box 2). These ‘period’ indicators describe average occupational situations within each OC and at different ages for the period studied, circa 2018.
Men in higher-level occupations can expect to live 6 years longer, on average, than manual workers after age 35
In 2018, life expectancy at age 35 of individuals born in France was 46 years 5 months for men and 51 years 7 months for women.
For men in higher-level occupations (cadres in French), it was 5 years 8 months longer than for manual workers, and for women, 3 years 5 months longer (Figure 1). These differences remain large at age 62: 3 years 6 months for men (for a total male life expectancy of 22 years) and 2 years 8 months for women (for a total female life expectancy of 26 years). The life expectancy of clerical workers is just above that of manual workers, while intermediate occupations and the self-employed (farm, trade, and craft workers with their own business) enjoy an advantage, but a smaller one than higher-level occupations. Among women, the self-employed have a lower life expectancy than those in intermediate occupations; the reverse is true for men. The results found here are similar to findings for earlier periods [according Insee Première, 1584].
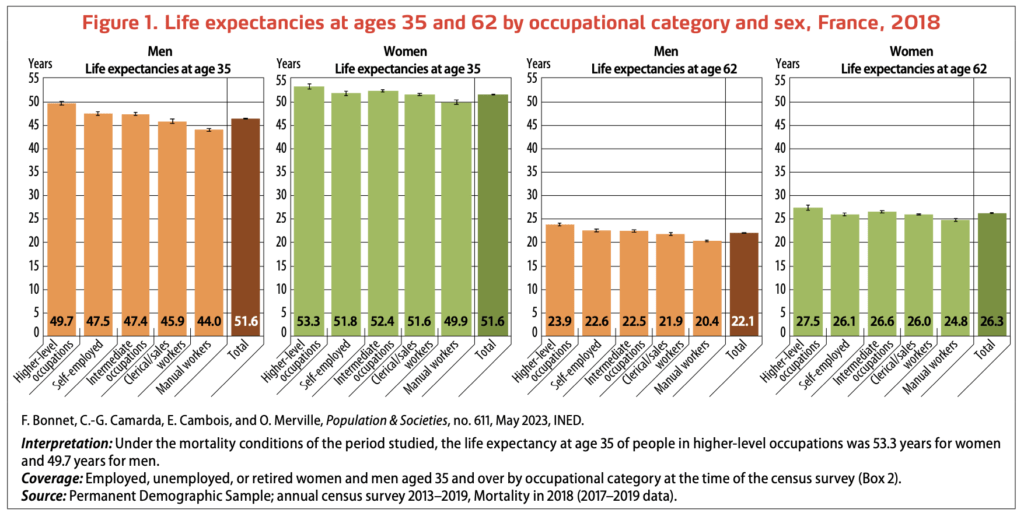
Disparities in the probability of reaching an advanced age are also observed across OCs because premature mortality also affects each category differently, although premature mortality is relatively low. At age 35, 96% of men in higher-level occupations but only 89% of male manual workers can expect to reach age 62. For women, the proportions are 97% and 94%, respectively.
Seven years of inactivity or unemployment for female manual workers after age 35
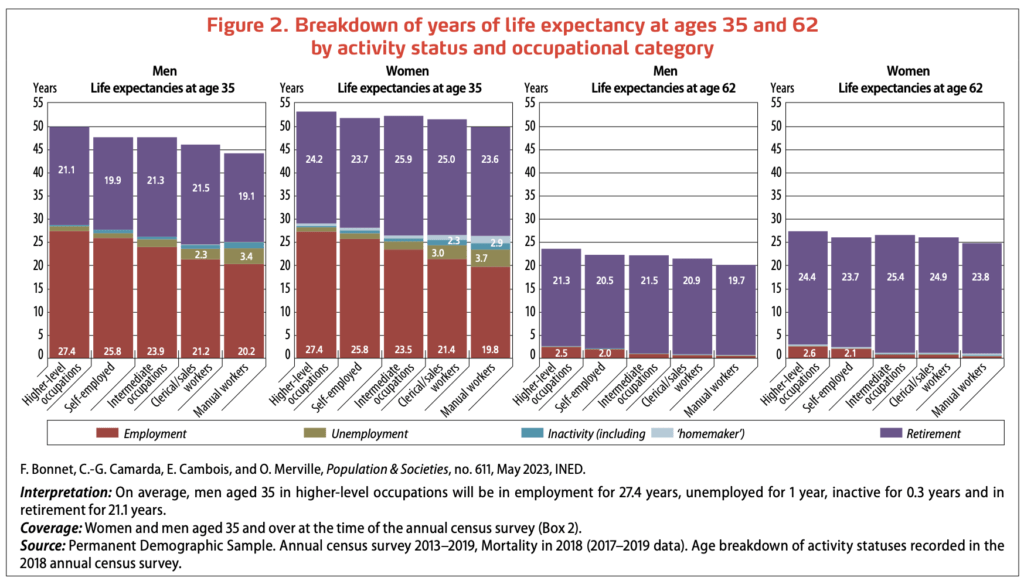
Figure 2 shows that the 53.3 years of life expectancy of women in higher-level occupations break down as almost 27.5 years of employment (around 51%) and slightly more than 24 years of retirement (around 45%); they also include around 1 year of unemployment and 1 year of inactivity (including due to disability). The life expectancy of female manual workers at age 35 includes slightly less than 24 years of retirement (47%), 8 months less than women in higher-level occupations; their periods in employment are much shorter—20 years on average (40%)— with more years of unemployment or inactivity: 4 years and 3 years, respectively (13%). Around half of women’s inactivity is reported as time spent as a ‘homemaker’, corresponding to career breaks often linked to childbearing or looking after the home (more frequent among the older generations than those of today). The other half corresponds partly to difficulties in keeping or finding a job, sometimes due to recognized or unrecognized disability. Such situations are also frequent for male manual workers.
Two fewer years in retirement for male manual workers than for men in higher-level occupations
Despite a younger retirement age than for men in higher-level occupations, male manual workers spend 2 fewer years in retirement (42% and 43% of life expectancy, respectively). They spend 3.4 more years in unemployment or inactivity.
The differences between OCs are quite similar for men and women, but the years in employment represent a greater share of the remaining years of life after age 35 for men than for women.
At legal retirement age (62 years for the period studied), there are fewer years of unemployment or inactivity, although still slightly more for women than for men. As mortality between ages 35 and 62 is quite low, the differences in years spent in retirement by OC at age 62 are similar to those at age 35. At age 62, the differences in duration of activity are large between people in higher-level occupations and the self-employed on the one hand, and intermediate occupations and manual workers on the other: the former continue working for another 2 years, partly due to later entry into the labour market, and the latter for less than 1 year.
At ages 58 and 59, some male clerical workers and women in intermediate occupations are already retired
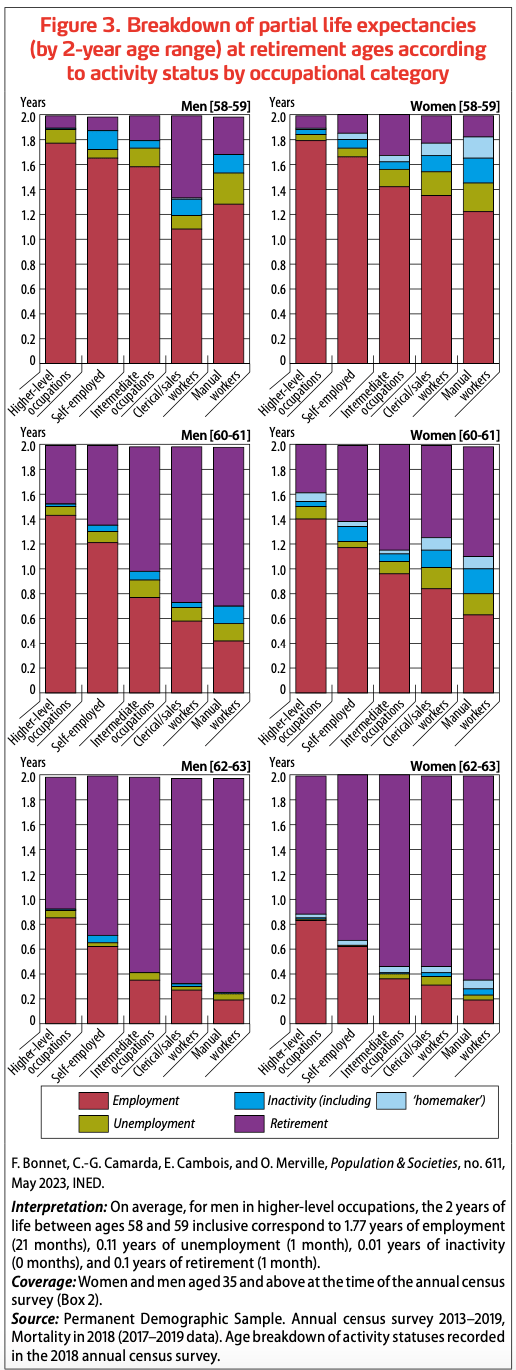
While most retirees are still working when they claim their pension, a non-negligible share is unemployed or inactive. Figure 3 shows the durations in each activity status by 2-year age group around the retirement ages (58–59 years inclusive, 60–61 years inclusive, and 62–63 years inclusive). Male clerical workers have already spent, on average, one-third of these 2 years to be lived between ages 58 and 59 in retirement, much longer than the other OCs. This specificity is linked to the existence of early retirement schemes for certain occupations in this category (Box 1). At these ages, manual workers are more frequently unemployed and inactive than the other OCs: these periods account for almost 5 months (0.4 years), i.e. 20% of these 2 years of life. Among women in the 58–59 age range, those in intermediate occupations have a slightly longer retirement period than other OCs. Female manual workers have a lower duration of activity than the other OCs due to a higher average duration of unemployment or inactivity (8 months on average).
At ages 60–61, just before the legal retirement age, men in higher-level occupations are active for almost 1.5 of these 2 years, 3 times longer than manual workers, who have a slightly longer period in retirement due to early retirement schemes, but also have periods of unemployment or inactivity 3 times as long. Among women likewise, female manual workers are in retirement for twice as long as women in higher-level occupations but are much more frequently unemployed or inactive (almost 6 months on average); their period of activity is shorter than for the other OCs (half that of selfemployed women, for example).
In the 2 years following legal retirement age (62–63 years), fewer people are unemployed or inactive as workers are entitled to claim their pension. Over the almost 2 years lived at these ages, female manual workers, clerical workers, and intermediate occupations spend between 18 and 20 months in retirement, self-employed women spend 16 months, and those in higher-level occupations 14 months. The duration in activity of women in higher-level occupations is still 4 times longer than that of female manual workers, as shown in Figure 2. In this age range, the situations of men and women in each OC are similar, with comparable durations spent in activity or retirement.
At age 35, the number of years in employment is higher for people in higher-level occupations than for manual workers who, for their part, have worked for longer before age 35 and have a higher risk of inactivity and unemployment. People in higherlevel occupations will also spend more years in retirement thanks to their longer life expectancy. In addition, women’s longer life expectancy translates as more years of retirement (3 to 4 more years depending on the OC), but also of inactivity (1 to 2 more years depending on the OC); within each OC, men and women have a similar duration in employment.
Just before the legal retirement age in the study period, clerical and manual workers have already spent time in retirement thanks to early retirement schemes. But these OCs have also had longer periods of unemployment or inactivity than the other OCs, probably due partly to difficulties in holding or finding a job [according to Les âges de départ à la retraite depuis 2010: quels enseignements pour la réforme à venir? Note IPP, 84, 1–8.]. This result mirrors the years of life with disability between ages 50 and 65 already experienced more frequently by manual and clerical workers than by people in higher-level occupations, and by women compared to men at identical ages [according La double peine des ouvriers: plus d’années d’incapacité dans une espérance de vie plus courte, Population & Sociétés, 441.].
Periods of non-employment before retirement, an indicator of complex trajectories at the end of working life, may adversely affect pension levels. Alongside the parameters of age and duration of contributions, protective schemes for people encountering difficulty in staying employed during their working career and in the years before retirement remain key challenges facing the pension system and social protection more generally, for both present and future generations.
[4] Disparités de rendement du système de retraite dans le secteur privé. Approches intergénérationnelle et intragénérationnelle (INSEE Work- ing Paper No. G2015/06).
[6] Camarda C.-G., 2012, MortalitySmooth: An R package to smooth Poisson counts with P-splines, Journal of Statistical Software, 50(1), 1–24.
Published by the Editorial Staff on